You asked, and we listened
We know tracking metrics across your projects is crucial for you and your team’s success. That’s why we’ve redesigned our Business Intelligence Dashboard to give you instant access to the insights that matter most to you in Dradis.
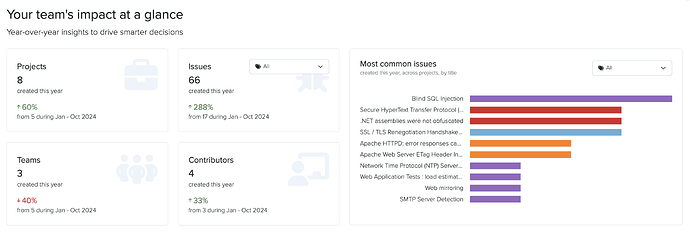
Get the big picture at a glance
-
Compare your current year achievements against previous performance
-
Track project and team growth with real-time counts
-
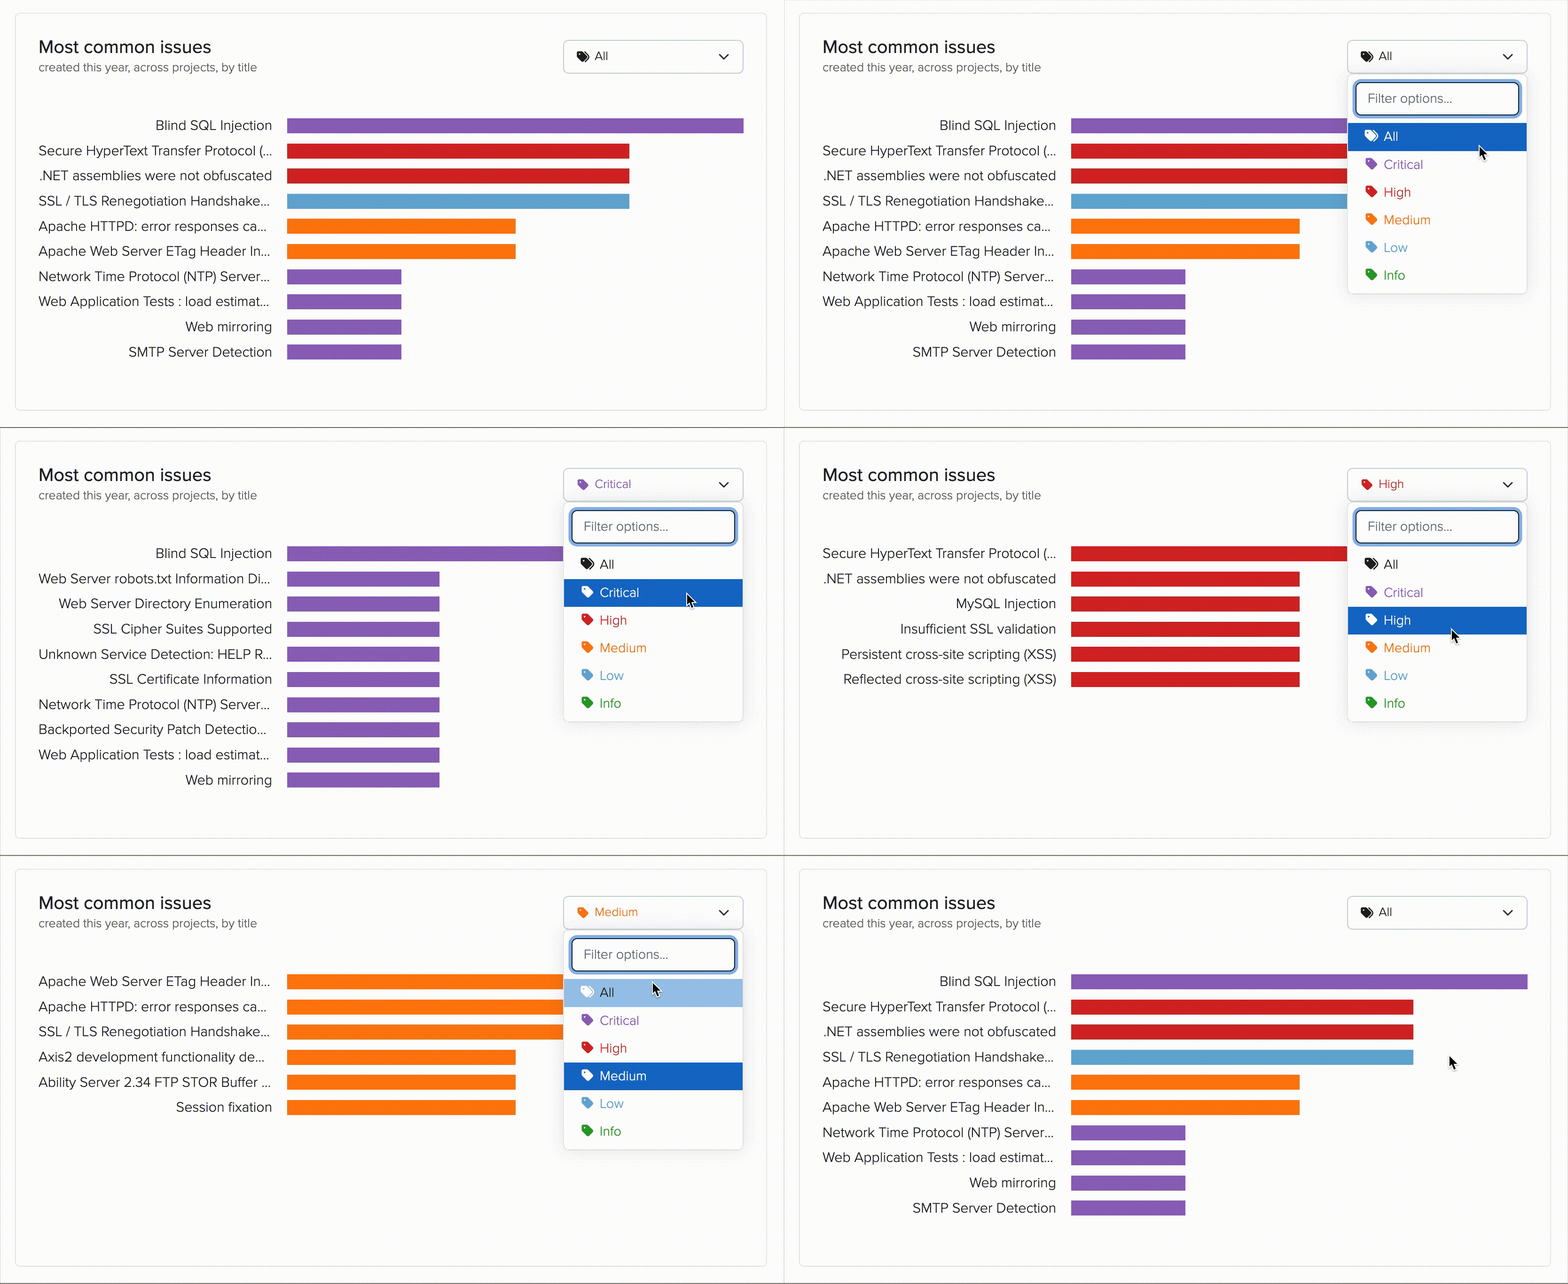
Monitor vulnerability identification across all your projects
Dive deeper with smart filtering
Filter your data by tags used across projects to focus on what’s most relevant to your work. Need to zero in on specific tags? Our enhanced filtering puts the right information at your fingertips.

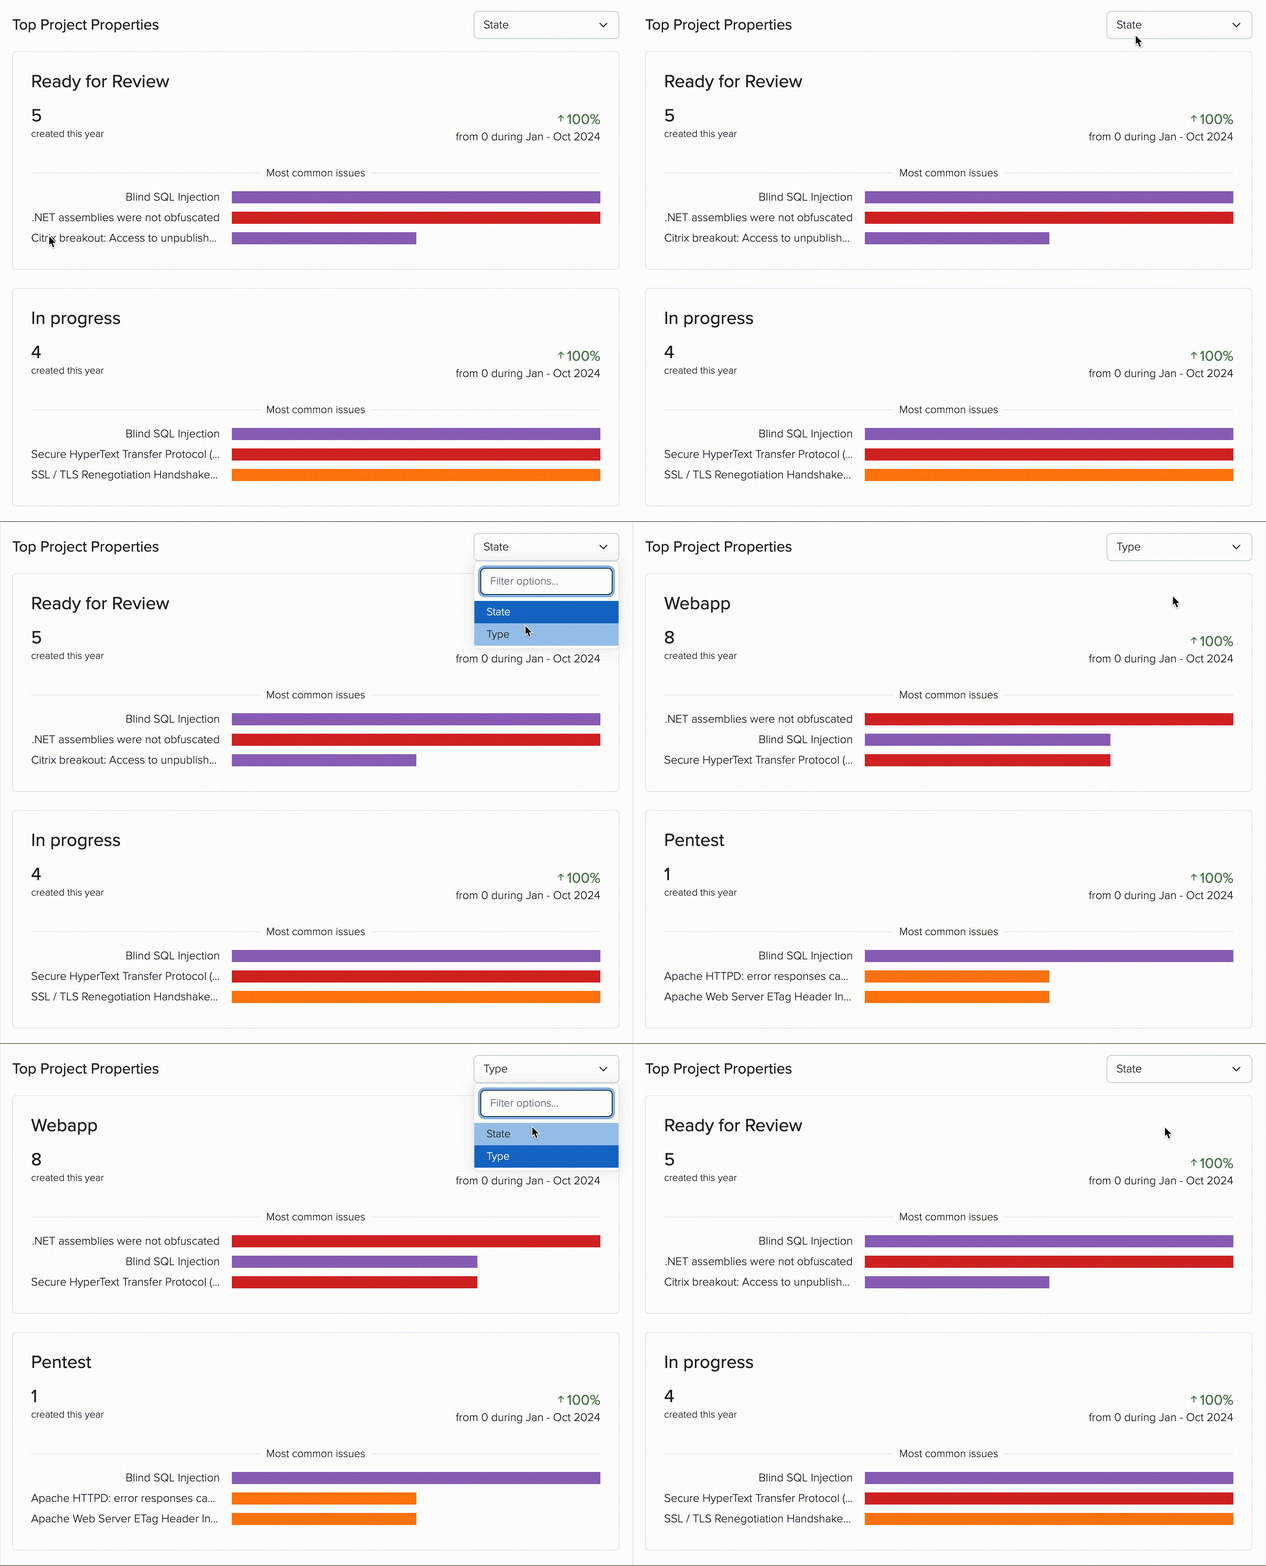
Set up custom properties for your teams to effortlessly answer questions like:
-
“What are the top 3 vulnerabilities affecting our Finance clients?”
-
“What are our most time consuming projects?”
-
“Which project types are the most common ones?”
The new dashboard transforms raw data into actionable insights, helping you make informed decisions faster than ever.

This is just the beginning
Our team is actively working to expand the Business Intelligence feature based on your feedback and evolving needs. We have exciting enhancements planned that will make your data analysis even more powerful and intuitive.
Ready to give it a try?
Take the new dashboard for a spin and discover how it can streamline your workflow.
We’d love to hear your thoughts and learn what features would be most valuable for your team’s success!

